Find the room to grow already in your catalog.
The free Claude skill on this page reads one metric, Ad Sales Ratio, across your catalog and returns the products with the most room to scale.
From the team operating $12B in GMV.
ASR is the share of a product's sales that ads are driving.
The lower the ratio, the more of the selling happens on its own, and the more potential the product has to be scaled with ad spend.
Ad Sales Ratio
ASR = ad sales ÷ total sales
Ad sales live in your ads console. Total sales live in Business Reports. Joining them per product is the work nobody does, which is why almost nobody has the number.
Sort by ASR, lowest first. The top of the list is where the room is.
Five products from one catalog, and no two lean on ads the same amount. The skill hands back every product you run, in this order.
| Product | ASR | The read |
|---|---|---|
| Desk Lamp | 20% | Four fifths of its selling happens on its own. First in line for more budget. |
| Wall Clock | 25% | Mostly organic. Room to test more spend. |
| Steel Tumbler | 30% | Ads do under a third of the work. Some room. |
| Ceramic Kettle | 45% | Ads carry almost half. Scale with care. |
| Aroma Diffuser | 55% | Ads do most of the selling already. Test before funding. |
Illustrative figures, not client data.
The lamp never makes a problem list, because nothing is wrong with it. That is the point of the ranking: the products with the most room are the ones no report flags. Reading one product takes a minute. A catalog, every month, is the part nobody gets to.
Three ways to put ASR to work.
Rank the room
Before budgets are set, sort the catalog lowest ASR first. Products that sell mostly on their own are the first place to test more budget.
Set targets per product
No two products can carry the same ad load. Read each product's ASR against your TACoS goal and the highest ACoS it can carry falls out, product by product rather than one blanket number.
Read the direction
Track ASR against total sales over time. A rising ratio on flat total sales suggests spend is substituting for organic. A falling ratio on growing sales means the product is strengthening.
ASR shows where to test, never whether the demand is there at a higher spend. That part is the test itself: move budget on a slice and read total sales.
Two ways to run it. Both are free.
No form, no email required. Take the file if you use skills, take the prompt if you do not.
The skill file
One zip, uploaded to Claude as-is: the SKILL.md, the prompt version, and the install steps.
- ASR at the org, category, and product level
- Every product measured against your own org average
- The ACoS ceiling and the room to grow spend, per product, against your TACoS goal
- A trajectory label per product: adding, substituting, or steady
- The goal, the window, and the trend sensitivity are editable lines
Requires your ad data connected to Claude over MCP.
Or just the prompt
Not using skill files? Paste this into Claude with your ad data connected. Any ad-data source works.
Using my connected Amazon ad data, pull monthly ad sales and total sales by product for the last 6 complete months, excluding the current partial month. Tag each row with category and parent (product family).

SETTINGS (edit these three lines)
TACOS_GOAL = 0.15
WINDOW = the last 6 complete calendar months
TREND_SENSITIVITY = 3 percentage points of ASR, and 5% of total sales

1. Compute Ad Sales Ratio (ASR = ad sales / total sales) at the org, category, and product-family levels over the window.
2. Report the org ASR month by month, and the org average ASR for the window. Use a sales-weighted org average, not a simple mean of family ASRs, and say which you used.
3. Flag each product family above or below the org average ASR, in percentage points.
4. For each product family, compute the ACoS ceiling = TACOS_GOAL * (total sales / ad sales), which is TACOS_GOAL / ASR. This is the highest ACoS you can run and still land at the goal. Alongside it, report the room to grow spend: TACOS_GOAL / (current ACoS * ASR), expressed as a multiple of current ad spend. Where current ACoS is below TACOS_GOAL, the goal never binds, so say "not limited by the goal" rather than printing a multiple.

5. Now do the same month by month for each product family, not just the org. For every family, report ASR per month across the window and total sales per month beside it. Compare the first three months of the window against the last three, and give the change in ASR in percentage points and the change in total sales as a percentage.

6. Label each family's trajectory from those two changes:
   - Ads adding: ASR up by at least TREND_SENSITIVITY points AND total sales up by at least 5%. Ad spend has been buying sales the product was not otherwise making.
   - Ads substituting: ASR up by at least TREND_SENSITIVITY points AND total sales up by less than 5%, flat, or down. Ad sales grew while the total did not, so spend has been taking credit for sales that were already happening. Flag these.
   - Organic strengthening: ASR down by at least TREND_SENSITIVITY points AND total sales flat or up. The product is winning more without ads.
   - Steady: everything else.
   Say plainly which families you could not classify, and why. Fewer than four months of data, a category change, or a stockout inside the window all make the label unreliable.

Return:
- The org ASR trend across the 6 months.
- The ASR of the top 4 product families by sales.
- A table of the top 5 parents with ASR, 6-month sales, variance against the org average in points, ACoS ceiling, room to grow, and trajectory label.
- Two short lists. First, families below the org average ASR that are not labelled "ads substituting": these have room and no evidence against using it. Second, families labelled "ads substituting" at any ASR level: these need a spend test before any budget goes in.
- Three sentences on what to change first, naming specific families.

Treat the levels as directional (ASR needs reliable total sales, and attribution windows shift ad sales), and always exclude the current partial month. The ACoS ceiling holds the goal on average across the family, not campaign by campaign.

On the trajectory labels: these are correlations drawn from history, not a controlled result. "Ads substituting" means the pattern is consistent with spend displacing organic sales, which is a reason to test before funding, not proof of cannibalisation. Confirm it by changing spend on a slice of the family and reading total sales rather than ad sales. Say so in the output rather than presenting the label as settled.
Same logic as the file, minus the tuning options.
Getting it running, in full.
The analysis takes a minute. The setup around it is where the real time goes, so here is the whole of it before you start.
-
Connect your ad data to Claude
Claude needs to reach your Amazon ad data, and MCP is how it gets there. That means an MCP server pointed at your ads source, running somewhere it stays running, holding credentials that someone has to issue and rotate.
If that connection is not in place, this is the step that takes the setup time, and it is rarely marketing's to do alone. A one-off export works for a single run if you want the answer before the connection exists.
-
Install the skill, or paste the prompt
Drop the SKILL.md into Claude under Settings, then Capabilities, then Skills. Or paste the prompt above into a normal conversation. Both produce the same table.
-
Set your goal and your window
The file ships with a 15% TACoS goal and six complete months. Change either line if yours differ. If different brands are managed to different goals, that is a separate run each.
-
Run it monthly, and act on it
ASR moves as organic rank moves, so a reading from March is a guess by June. The list is only worth having if it reaches the person setting budgets while it is still current.
It reads data and returns a list. It does not change bids, budgets, or anything else in your account.
Or skip steps one and four
Qore arrives with the connection already made and runs the analysis on a schedule. Same method, none of the setup and none of the remembering.
The questions we get every time.
Is ASR not just TACoS by another name?
It is one of the two numbers TACoS is made of. TACoS equals ACoS times ASR, so any two of the three give you the third, and ASR is not independent information. What it gives you is the split. A TACoS that has risen from 6% to 9% has either got more expensive per sale or started taking a bigger share of the product's sales, and those call for opposite responses. TACoS on its own cannot say which. That is also why the headroom figure in the output comes from TACoS rather than ASR, while the highest carryable ACoS, the organic share, and the substitution trend all need ASR specifically.
How do I turn ASR into an ACoS target?
Multiply ACoS by ASR and you get TACoS, so the math flips cleanly: your TACoS goal divided by a product's ASR is the highest ACoS that product can carry and still land on the goal. Against a 15% goal, a product at 20% ASR can carry up to a 75% ACoS, while a product at 55% ASR tops out near 27%. Nobody is telling you to run a 75% ACoS; the number measures distance from the goal. The skill returns this ceiling for every product, which is how one account goal becomes a target each product can hold.
Does a high ASR mean the product is saturated?
No, and the skill will not claim it does. ASR tells you what share of a product's sales ads are responsible for. It cannot tell you whether the next dollar buys a new sale or takes credit for one you were getting anyway, because ASR rises in both cases. What separates them is total sales, which is why the skill reads each product's ASR against its own total-sales trend across the window. Rising ASR with total sales rising means spend has been adding. Rising ASR with total sales flat means it has been substituting. That is a pattern in your history rather than a controlled result, so treat it as a reason to test before funding. The test is to change spend on a slice and read total sales, not ad sales.
What counts as a high ASR?
Whatever is high for you. There is no universal right number: a category where buyers discover products through ads will run a high ASR across the board and be perfectly healthy, and a heritage brand with strong organic rank will run low everywhere. The skill benchmarks every product against your own sales-weighted org average and reports the variance in percentage points, so the comparison is internal rather than borrowed.
Are you telling me to pay for sales I already have?
No, and the test is cheap. If the extra spend only displaced organic sales, total sales would not move, and you would see that inside a cycle. Your TACoS goal is the guardrail while you find out: on a product where ads bring in 20 cents of the dollar, a serious increase still leaves total ad cost inside your goal. Two things this does not tell you are whether the demand is there at that volume, and whether your ACoS holds as you push it. Both are answered by testing, not by arithmetic.
Is the ACoS ceiling the same as break-even ACoS?
No, and you want to respect both. Break-even ACoS comes from your unit economics and tells you where a sale stops being profitable. The ACoS ceiling comes from your TACoS goal and how much of a product's sales come from ads. A product can sit under its ceiling and still lose money on margin, so treat the ceiling as the efficiency limit and your break-even as the harder stop.
Do I need Claude Code, or does this work in the app?
Either works. The skill is a single file you install in Claude, and the prompt version runs in a normal conversation. What matters is that Claude can reach your ad data, not which surface you are in.
What data does it touch?
Monthly ad sales and total sales by product for six complete months, tagged with category and parent. If you only have child-level data it rolls up to parent first. It pulls through your own connection, so the data path is yours, not ours.
Why six complete months and not twelve?
Six is long enough to smooth a promotional spike and short enough that the ratio still describes the product you are selling now. The current partial month is excluded because a half month of sales against a full month of ad activity distorts the ratio. Both values are editable in the file.
Qore runs this across every account, every month, before you set budgets.
Qore is the workflow layer of the Trellis platform. You describe a check once, it gets locked into a workflow, and it runs on a schedule against every account you manage.
Connected on day one
No MCP setup on your side. Your ad data is already there.
Runs every month
The window rolls forward and the partial month drops out, with nothing to remember.
Tuned to each portfolio
A different TACoS goal per brand or account, set in the interface rather than in a file.
One queue for the team
The list lands where budgets get set, so the person moving spend sees the same ranking as the person reviewing it.
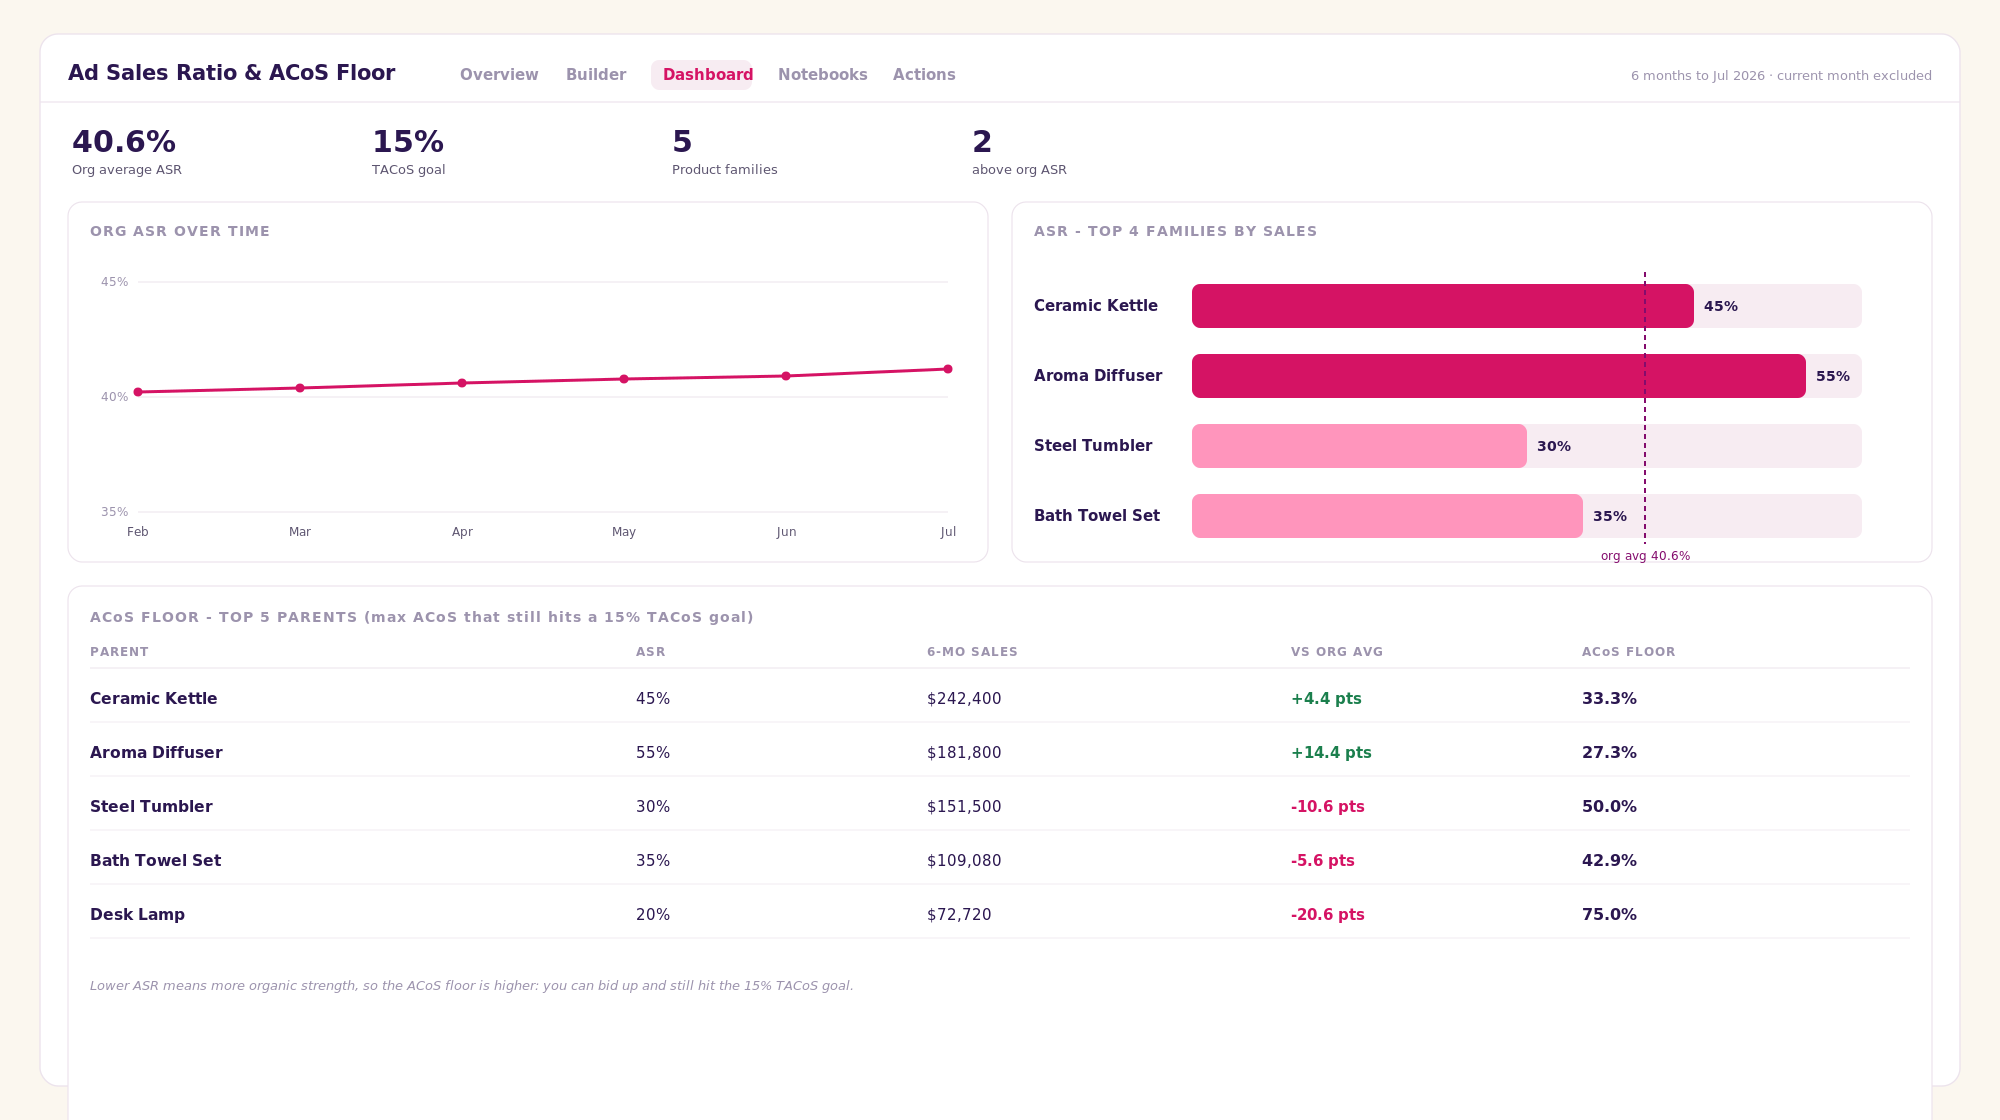
Six months to the last complete month, with the current partial month excluded.
See this run on your accounts
Create an account, connect your data, and the ASR analysis runs on your own catalog: your list, not our example.
Qore is in open beta
One useful climb a month.
The Climb is Trellis' monthly newsletter: quick updates from Amazon, Walmart, and the other marketplaces, upcoming webinars, and the practices driving profitability right now.