When revenue dips or margin disappears, most sellers ask the same question: “Is it our pricing or something else?” Answering that used to take hours of spreadsheet digging, gut-based decisions, or slow “trial and error” tests. A visual, evidence-backed view of your pricing performance can be the difference between stalled growth and revived margins. It helps sellers quickly understand where pricing is working, and where there’s untapped opportunity so you can take action with confidence.
Why Most Dynamic Pricing Tools Fall Short?
Many tools promise “dynamic pricing,” but often fall into one of two traps:
- Over-automation without visibility. You see the price change, but not the why behind it.
- Reporting without direction. You get metrics but no clarity, no actionability, and no confidence.
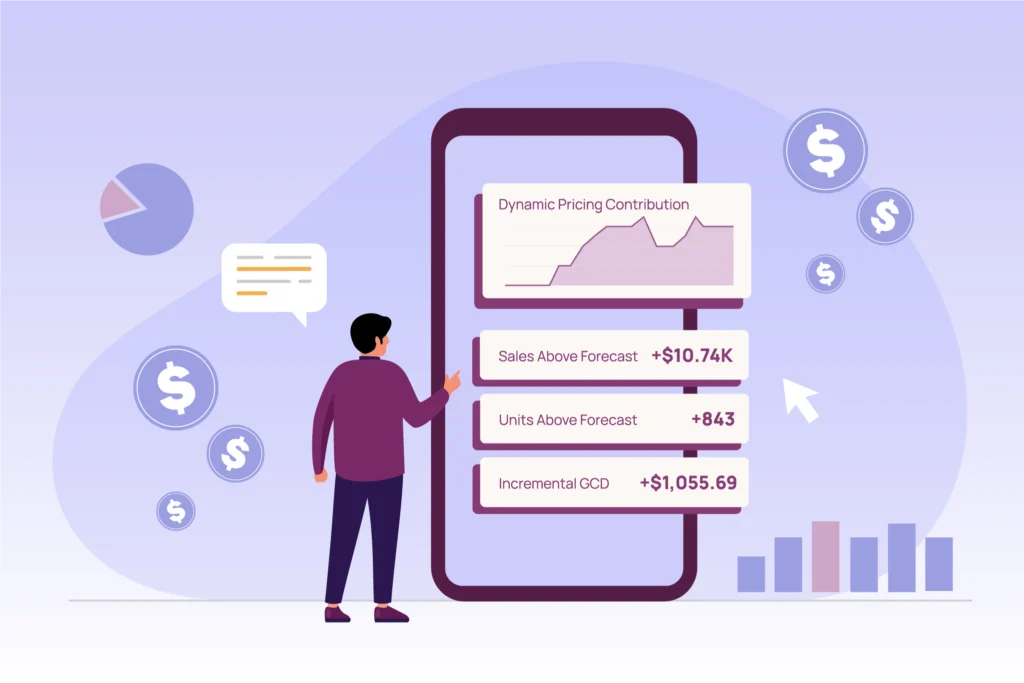
Sellers require more than raw data. They need actionable insight. The Dynamic Pricing Dashboard delivers exactly that: a solution built for clarity to help Amazon Sellers take their next step.
The Trellis Dynamic Pricing Dashboard helps turn complex pricing data into clear, confident decisions. It visualizes pricing performance across SKUs using quadrant-based strategy views, revenue attribution, and inventory-aware pricing signals.
Key Visual Features That Drive Smarter Pricing
1. Benchmarks vs. Actuals: Are You On Pace or Falling Behind?
The dashboard compares your current sales performance to market benchmarks using rolling conversion rates, median price across a 90 day window, and daily pageviews so you know if your pricing is accelerating or stalling growth.
Why it matters? You see when you’re misaligned to take action and diagnose underlying problems.

2. Performance Quadrants: Instantly Spot What Needs Fixing
Each pricing plan is plotted into one of four quadrants:
- Green: Profit Margin and sales-volume up which means keep going.
- Red: Profit Margin and sales-volume down which signals to cut or fix now.
- Orange: High sales-volume, low margin suggests defensive play.
- Blue: High margin, low sales-volume suggests pricing might be too high.
Why it matters? Clear takeaways. The visual strategy grid lets you know at a glance where to double down and where to take corrective action.

3. Revenue Attribution: What’s Pricing Actually Worth?
Our Pricing Dashboard isolates the impact of pricing changes from other variables (like ads or seasonality). The Gross Contribution Delta (GCD) shows you exactly how much more or less revenue you generated because of pricing decisions.
Why it matters? Understand the true trade-off between margin and volume connected to pricing decisions. Attribute the right tactics to your growth.

4. Inventory-Sensitive Adjustments: Clear Overstock, Protect Winners
The dashboard tags SKUs based on stock status (e.g. overstocked, understocked) and adjusts pricing recommendations accordingly without damaging your high-value SKUs.
Why it matters? Avoid panic discounts and overstocking fees. Use pricing to turn inventory from a liability into a lever.

Turning Insight into Growth
What makes this dashboard unique isn’t just what it shows, it’s what it enables:
- See where additional revenue actually came from or didn’t.
- Fix underperforming plans fast before they drag down overall results.
- Adjust pricing with full confidence backed by clear directional data.
- Align pricing with forecasting and inventory management all in one place.
In short, the dashboard helps sellers stop guessing and start compounding results.
Use Cases That Matter to Sellers Today
- Overstock problems? Our dashboard flags them and suggests smart markdowns.
- Struggling SKU? Use quadrant visuals to decide whether to pivot, raise price, or drop the strategy altogether.
- Margin erosion? Gross Contribution Delta justifies strategic price increases even at the cost of volume.
- Missed your forecast? Find out if it’s a pricing issue or something else entirely.
Trellis’ Dynamic Pricing Dashboard isn’t just about tracking prices. It’s about making pricing clear, contextual, and controllable. Sellers shouldn’t have to wait weeks to know what’s working or wonder if they should drop the price again.
With visual diagnosis, real attribution, and inventory-aware logic, this tool helps you stop reacting and start steering.
Ready to stop guessing and start diagnosing? Book a demo and explore the Dynamic Pricing Dashboard!