In the fast-paced and competitive world of Amazon, understanding advertising intricacies and maximizing sales growth is crucial for brands aiming to succeed. One essential aspect that confuses sellers is the relationship between impressions and sales.
Recently, during a conversation with a struggling brand, we delved into the concept of the impression curve, shedding light on its significance. Understanding how other sellers could benefit from this concept, this blog explores the Amazon impression curve, its various zones, and how comprehending this curve can pave the way for profitable growth.
By dissecting the nuances of each zone and offering practical examples, we aim to equip brands with the knowledge they need to troubleshoot and adjust their advertising strategies more effectively.
If you want to see how real brands moved from low visibility to steady growth, explore our Success Stories. You’ll find quick examples of how Trellis helped teams improve their ad performance and boost revenue.
Key Insights
- Strong impressions come from matching your bids, budgets, keywords, and listing content to how shoppers search. When these pieces work together, you earn visibility with less wasted spend.
- The impression curve highlights three stages of growth — Idle, Growth, and Top of Search. Each stage requires different bidding strategies based on your goals and your product’s life cycle.
- Impressions alone aren’t enough. You need relevance, strong listings, and competitive pricing to turn visibility into clicks and sales.
What’s an impression curve?
The impression curve represents the relationship between impressions and bids across three bidding zones; Idle, Growth, and Top of Search (ToS). The Amazon Impressions Curve can be visualized as a journey that brands embark upon to gain exposure and drive sales through advertising.
Read more: How to Solve ‘No Impressions’ in Amazon Ads
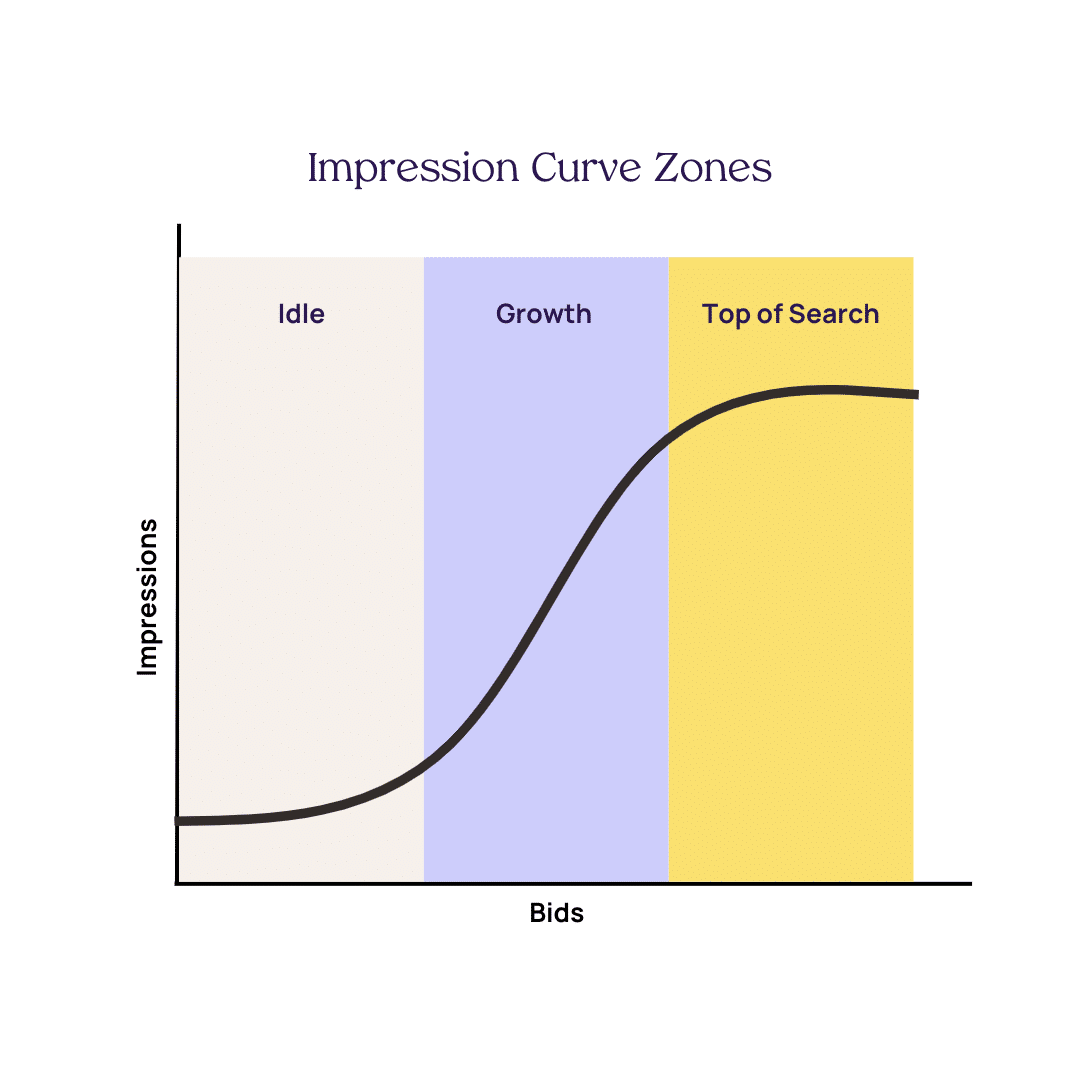
This curve can be divided into three distinct zones, each offering unique opportunities and considerations based on the aggressiveness of a brand’s bidding strategy and its specific goals.
- The Idle Zone represents the starting point of the impression curve. Brands find themselves in this zone when their bids are set conservatively, resulting in minimal impressions. Operating in the Idle zone may be suitable for brands with limited budgets or those testing the market with a cautious approach. While costs remain low, limited exposure and lower sales volume are trade-offs.
- The Growth Zone offers significant potential for brands seeking profit and volume growth. By raising bids strategically, brands can increase impressions, exposing their products to a larger audience. Brands choose to operate in the Growth zone when they want to expand their customer base and drive sales growth. With a more aggressive bidding strategy, they can optimize their exposure to a growing audience.
- The Top of Search (TOS) Zone represents the peak of exposure, where impressions saturate and products gain maximum visibility. Brands in the TOS zone aim to achieve the highest level of exposure, prominently positioning their products at the top of search results. However, it’s important to note that operating in the TOS zone comes with higher costs.
By analyzing this curve, brands gain valuable insights into optimizing their advertising strategies and the impact on costs and sales.
Zone | Impressions | Click-Thru | Conversions | Cost |
Idle | Low and flat until inflection | Statistically insignificant | Statistically insignificant | Low |
Growth | Growing | Increasing | Growing exposure to higher purchase intent audience | Medium |
Top of Search | High flattening saturation | Most exposure to consideration audience | Higher overall conversions but lower as a ratio of clicks/cost | High |
Get a clearer view of how your keywords stack up. Try our Keyword Discovery Tool to find high-intent terms that help your ads earn more impressions.
Idle Zone
The Idle zone is characterized by several factors that influence brands’ bidding strategies. This zone is often relevant for brands with limited budgets, products with low-profit margins, or whose primary objective is to maintain margins rather than actively grow.
Limited budget
One reason brands may find themselves in the Idle zone is having a limited advertising budget. In such cases, bidding conservatively controls costs and maximizes budget longevity. By setting low bids, brands ensure their advertising efforts are sustainable within their financial constraints.
Low-profit margins products
Certain products may have inherently low-profit margins due to various factors such as production costs, market competition, or pricing constraints. For brands selling these types of products, the Idle zone can be a strategic choice to avoid spending excessively on advertising while still maintaining a viable business.
Maintaining margins
In some instances, brands may prioritize maintaining profit margins rather than aggressively growing a product. By operating in the Idle zone, they can limit their CPC while still generating enough sales to sustain their desired profitability.
Conservative approach
Being conservative in bids is unlikely to generate significant customer engagement or drive substantial revenue. Click-through rates and conversions may be statistically insignificant, indicating a lack of traction and limited interest from potential customers.
It’s important to note that there is an inflection point within the Idle zone where bids can be adjusted to move into the Growth zone. Brands need to monitor performance closely and identify this point to gradually increase their bids and gain more exposure
Growth Zone
The Growth zone within the impression curve is of significant importance for brands aiming to achieve profitable growth on Amazon. This zone presents opportunities for optimizing bidding strategies and driving sales volume and profit.
Profit and volume
The Growth zone holds immense potential for profit and volume growth. By optimizing bidding strategies, brands can increase impressions, gain visibility, and capture potential customers’ attention. This ultimately leads to higher sales volumes and revenue generation. The Growth zone allows brands to expand their market reach, attract new customers, and enhance their overall business growth on Amazon.
Rate of change
To make informed bidding decisions within the Growth zone, it is essential to understand the rates of change in impressions, sales volumes, and costs. By analyzing these factors, brands can identify trends and patterns that optimize their bidding strategies.
Impression growth
Monitoring the rate at which impressions increase the most as bids are adjusted provides insights into the effectiveness of bidding strategies. Within the Growth zone, the gradient is the highest in which incremental increases in bids will get significant visibility.
Sales volume impact
Analyzing the relationship between bid adjustments and corresponding changes in sales volume helps brands understand the impact of bidding on their overall revenue. Brands can identify the bid levels that maximize sales while avoiding excessive costs.
Cost efficiency
Understanding how costs change in relation to bid adjustments allows brands to maintain cost-efficient advertising campaigns. By optimizing bids, brands can achieve the desired level of impressions and sales volume while minimizing unnecessary expenses.
Data analysis
To successfully navigate the Growth zone, brands must engage in complex data analysis. This involves analyzing performance metrics, monitoring trends, and identifying patterns to make data-driven decisions.
Brands can leverage advertising automation to alleviate heavy data analysis, save time and money, and get efficient results. By understanding the rates of change in impressions, sales volumes, and costs, brands refine their bidding strategies and optimize their advertising campaigns for maximum growth.
Bid strategies
If you want to manually test impressions and bids in the Growth zone, here are two ways to adjust your bids:
Gradual bid adjustments
Incrementally increasing bids within the Growth zone enables brands to observe the impact on impressions and sales volumes. By closely monitoring the rate of change, brands can find optimal bid levels that generate meaningful growth while keeping Amazon PPC cost in check.
Competitor analysis
Monitoring competitor bids and positions within the Growth zone provides insights into market dynamics. Brands can adjust their bids strategically to maintain competitiveness without overspending. This approach helps secure favorable placements and exposure while maximizing returns.
Want steady tips that help you grow your eCommerce business? Subscribe to The Climb, our monthly newsletter with quick insights, trends, and updates to help you stay ahead.
Top of Search (ToS) Zone
The Top of Search (TOS) zone within the Amazon Impressions Curve represents the pinnacle of exposure, where brands can secure a prominent position on the first page of search results. This zone offers several advantages, including a larger share of the digital shelf, increased visibility, and higher conversion rates.
Share of shelf
Being in the TOS zone allows brands to get maximum visibility. The first page of search results is prime real estate on Amazon, as it receives the highest visibility and customer engagement. Brands can showcase their products prominently, increasing clicks and conversions.
High margin products
The TOS zone is particularly appealing for brands offering high-margin products. Increased visibility and exposure helps drive sales of these products, resulting in better ROAS. By targeting the TOS zone, brands can prioritize advertising and visibility of their most profitable offerings.
Boost organic rankings
A prominent position in the TOS zone can improve search rankings for relevant keywords. The increased visibility and click-through rates signal to Amazon’s A9 algorithm that the product is highly relevant and popular among customers. As a result, Amazon’s algorithm rewards the brand by boosting its organic search rankings. This leads to higher visibility in both paid and organic search results.
Positive customer reviews and feedback
Higher visibility in the TOS zone often leads to increased sales, which, in turn, generates more customer reviews and feedback. Positive customer reviews are valuable social proof that influences other customers’ purchasing decisions. As a brand accumulates more positive reviews, it strengthens its reputation and credibility, further fueling organic growth.
Why Are My Impressions Low…and How Do I Fix It?
Low impressions usually come from a few common issues: low bids, tight budgets, weak keyword alignment, or listings that don’t match shopper searches. Start by checking your bid strength and making sure your daily budgets don’t cap out early. Then confirm that your listing includes the keywords you’re targeting.
Also review your targeting. Keywords with low search volume or very narrow match types may not generate many impressions. Broadening your targeting or adjusting your match types can help your ads re-enter the auction and recover visibility.
How to leverage the Amazon Impression Curve?
To leverage the Amazon Impression Curve effectively, brands should consider the different stages of the product life cycle and the opportunities presented by seasonal variations. By aligning their bidding strategies with these factors, brands can optimize their advertising efforts and achieve their goals.
Product life cycle goals
Launch phase: During the launch phase, the primary goal is to generate awareness and attract early adopters. Brands leverage aggressive impression zones to test the market and discover keywords. The focus is on generating initial traction and establishing a foothold in the market.
Growing phase: In the growth phase, the goal is to expand the customer base and drive sales volume. Brands can gradually increase bids to move into the Growth zone and gain more exposure. The key is to optimize impressions, click-through rates, conversions, and costs. The focus is on steady growth while maintaining profitability.
Best-seller phase: Once a product becomes a best-seller, the objective is to maintain consistent sales and maximize profitability. Brands can balance between Growth and Top of Search Zone to maintain their share of shelf and cost-effectiveness. The goal is to increase overall conversions while ensuring a healthy ratio of clicks to cost. The focus is on sustaining best-seller status and profitability.
Clearance phase: When a product reaches the clearance phase, brands may increase bids to liquidate remaining inventory, or lower them to maintain profitability or low-inventory situation. The emphasis is on minimizing costs while generating sales. The focus is on clearing out stock efficiently and making room for new products.
Leveraging shopping seasons
Seasonal variations and events allow brands to optimize their bids and leverage the Amazon Impression Curve effectively. By understanding customer behavior during different seasons, brands can adjust their bidding strategies to align with increased demand and capitalize on seasonal trends.
Here’s how:
Peak season: During peak seasons, such as holidays or specific occasions, customer demand spikes. Brands can increase their bids strategically to secure positions in the TOS zone, ensuring maximum exposure during high-demand periods. By optimizing bids for increased impressions, brands can capture a larger share of the market and drive sales.
Off-peak season: During slower periods, brands can adjust their bidding strategies to align with lower demand. They may choose to operate in the Idle zone or strategically decrease bids to control costs while maintaining a minimum level of visibility. This approach helps manage advertising expenses during less competitive periods.
How Trellis Can Help With Low Amazon Ad Impressions
Trellis uses AI to monitor your bids, adjust your spend, and help your campaigns reach the right shoppers at the right time. Our platform analyzes your listing, keyword coverage, and performance trends to show you where impressions are dropping and why. You get full-funnel insights, automated bidding, and the tools to scale visibility without guesswork.
If you want stronger reach and more efficient ad performance, book a demo to see Trellis in action.
How Does Keyword–Listing Alignment Affect Impressions?
Amazon shows your ads when your keywords match shopper searches and match the language in your listing. If the keywords you bid on don’t appear in your title, bullets, description, or backend fields, Amazon sees your ad as less relevant. That leads to fewer impressions.
To improve visibility, make sure your listing includes the same terms you target in your campaigns. Strong alignment helps Amazon understand your product and match your ads to more searches.
Can Budget Limits and Bids Reduce Your Impressions?
Yes. Every impression starts with an auction. If your bids are too low or your budget runs out early in the day, your ads stop showing. Low impressions often mean your campaigns are losing auctions before they even have the chance to appear.
Check that your bids match the average cost-per-click in your category and confirm your daily budgets can support a full day of traffic. A competitive bid and steady budget help your ads stay visible when shoppers are most active.
Do Different Ad Formats Earn Impressions Differently?
They do. Sponsored Products often earn the highest number of impressions because they appear across search results and product pages. Sponsored Brands can secure top-of-search placement, which is useful for awareness and early visibility. Sponsored Display impressions depend more on your audience targeting and can appear across Amazon or offsite.
Choosing the right mix helps you reach your goals. If you need scale, Sponsored Products reach the most shoppers. If you need brand lift, Sponsored Brands put your name front-and-center. If you want to re-engage shoppers, Sponsored Display helps you stay visible across their journey.
Closing thoughts
Effectively implementing the Amazon Impressions Curve requires a data-driven approach and continuous learning. Analyzing performance metrics such as impressions, click-through rates, conversions, and costs is crucial to understanding the dynamics of the curve and optimizing bidding strategies.
To navigate the curve successfully, brands can benefit from AI platforms that offer advanced analytics and insights. These platforms provide valuable data and metrics that enable brands to make informed bidding decisions. Advanced analytics tools offer market intelligence into the performance of keywords, ad campaigns, and competitor analysis. This empowers brands to refine their bidding strategies for maximum impact.
Trellis’ advertising automation offers a seamless workflow to collect data, test, and act on them. Book a demo now to learn more about Amazon impression curve implementation into your advertising strategy.