Looking for a birds-eye view of your Amazon category? Download our live Amazon bencmark reports.

  • Platform
    Back
    • Advertising

      Benefit from smart, AI-powered ad scaling for your listings.

    • Dynamic Pricing

      Set automated pricing using the power of machine learning.

    • Workflow

      Optimize multiple e-commerce campaigns with one click.

    • Content

      Let our algorithm generate SEO-rich content for you.

    • Promotion

      Harness cutting-edge software to drive higher conversions.

    • Market Intelligence

      Gain access to game-changing data and dashboards.

    “I am able to automate the implementation of data-driven decisions.”

    Tobi O, Luxe Weavers
    Read success stories

    Ready to get started? Book a demo

    PricingChat to sales
  • Solutions
    Back
    • Growing brands

      Small team? Let us to be your virtual CMO.

    • Established brands

      We help seasoned marketers automate tedious decisions.

    • Agencies

      Turbocharge your clients’ ads, giving you room for more business.

    • Brand Aggregators

      Optimize your investment and prepare for a profitable exit.

    ecommerce merchandising strategies for merchandising experts

    How optimizing the same variables over and over again is stagnating your eCommerce store.

    Merchandising Strategy
    Building a Merchandising Strategy

    Ready to get started? Book a demo

    PricingChat to sales
  • Pricing
  • Marketplaces
    Back
    • Amazon

      Sell more on the world's largest eCommerce marketplace.

    • Walmart

      Optimize your listings with the world's largest retailer.

    • Google Shopping

      Reach more customers through the world's most popular search engine.

    “For a data guy, I also knew that AI and machine learning were the answer to my ability to successfully advertise on Amazon.”

    Map Sherpa
    Read success stories
  • Free Tools
    Back
    • Amazon Sales Estimator

      Free tools for product research.

    • Amazon Listing Analyzer

      Insights to optimize your listing.

    • Amazon Keyword Discovery Tool

      Keywords to accelerate growth.

    • Amazon ACOS Calculator

      Setup profitable campaigns.

    • Price Elasticity Calculator

      Find your optimal price.

    • Amazon Competitor Analysis

      Outcompete with real-time data.

    12 Ways to grow with 4ps of digital marketing

    Which ways can Trellis help accelerate your strategy?

    12 Ways to Grow Your Brand Using the 4Ps

    Ready to get started? Book a demo

    PricingChat to sales
  • Resources
    Back
    • Blog
      • Understanding the Amazon Impression Curve
        Understanding the Amazon Impression Curve
        How to Improve Your GMV on Amazon?
        How to Improve Your GMV on Amazon?
        Using strategic ecommerce automation
        Case Study: 450% Growth With Strategic 4...
        How to Create Amazon Product Listing Using AI?
        How to Create and Analyze Amazon Content...
        Read All
    • eBooks
      • Amazon PPC Strategy ebook
        Advanced Amazon PPC Strategy eBook
      • Ecommerce Quadrants: Interlock Your Amazon Growth Strategy
      • Subtle Art of Pricing Amid Economic Downturns
      • Real Data Rundown: Increasing Ad Spend During BFCM
    • Success Stories
      • Using strategic ecommerce automation
        Case Study: 450% Growth With Strategic 4...
        Walmart Advertising Software Case Study
        Case Study: 12X Luxe’s Sales With ...
        Case Study: World Products Increases Sal...
        Sponsored Brands Video 101: Harness the ...
        READ ALL
    • Trellis Training
      • Platform Overview
        setup and configuration ads automation
        Setup and Configuration
        Category Targeting
        Scheduled Budgets
        Read More
    • Platform News
      • Trellis Supercharges the 4Ps of Marketing With the World’s First  Merchandising Platform for Amazon Sellers
        Trellis Launches the First 4P Platform f...
        Press Release: Trellis to Provide Supercharged Walmart Advertising With Best-in-Class AI and Automation
        Trellis to Provide Supercharged Walmart ...
        Control With Automation
        A New Automation Experience: Gain More C...
        Trellis Corporation Raises $1.5M In Seed...
        READ ALL
    • Guide to Merchandising
      • Merchandising Manifesto
    • Benchmark Reports

    Ready to get started? Book a demo

    PricingChat to sales
Login Schedule a demo

Category

  • Amazon PPC

How to Use Amazon Brand Analytics to Improve Your Market Share

Share
Areeba Khan

Areeba Khan

  • March 4, 2022

Amazon has been courting more companies onto its platform over several years. As part of this initiative, they’ve made one of their most advanced sales and analysis tools accessible only to Amazon Brand Registry vendors.

Brand Registry is a platform that is exclusively available to registered trademarks. Amazon analytics has been here for a long time. However, recent changes have made it a must-have feature for firms selling their items on the platform. Amazon Brand Analytics (ABA) now has better data and a new report for marketing attribution.

In addition, Amazon also confirmed the debut of the Search Analytics Tool in October 2021. This tool will give third-party merchants product and service search performance analytics.

Here’s all you need to know about Amazon Brand Analytics:

Table of contents
  1. What is Amazon Brand Analytics?
  2. Who Can Use Amazon Brand Analytics?
  3. How Do I Access Brand Analytics?
  4. 5 Types of Reports in Brand Analytics
    1. Demographics
    2. Item Comparison and Alternate Purchase Behavior
    3. Amazon Search Terms Report
    4. Trellis Simplifies
      1. What is the meaning of search frequency rank?
      2. What is the difference between a click share and a conversion share?
    5. Repeat Purchase Behavior
    6. Market Basket Analysis Report
  5. How to Use Amazon Brand Analytics?
  6. Improve your Overall Brand Outlook with Trellis

What is Amazon Brand Analytics?

Amazon Brand Analytics is a collection of reports provided to Amazon Brand Registry members who have been approved.

Brand owners may use this function to monitor consumer behavior, popular search phrases, competition achievements, and advertisements.

This additional data can help Amazon sellers make choices that increase their sales.

If you’re a member of Amazon’s Brand Registry, sign in to your account and look under the ‘Brands’ page for these stats. You can sign up on the platform if you haven’t already. It’s free, but you must have a registered brand to participate.

“Brand Analytics is a tool that provides significant data to empower Brand Owners to make educated, key decisions regarding their product offering and marketing campaigns” according to Seller Central. 

Who Can Use Amazon Brand Analytics?

As a vendor, you must satisfy the following conditions to utilize Amazon Brand Analytics:

  1. You must be a registered member of the Amazon Brand Registry.
  2. You must be a brand owner.
  3. Your brand should be a registered trademark that is in use.
  4. You should be in charge of marketing the brand on Amazon.

You can apply to join Amazon Brand Analytics if you fulfill all of these requirements, excluding the Amazon Brand Registry criterion. Take note that there is no charge for registering to join ABA. 

How Do I Access Brand Analytics?

Getting access to ABA is very easy. Here are the steps:

  1. Sign in to your Amazon Vendor or Seller Central account.
  2. Select the “Report” option from the main menu.
  3. From the drop-down menu, select “Brand Analytics.”

And that’s it! You can now go ahead and skim through the vast brand improvement tools that ABA has to offer.

5 Types of Reports in Brand Analytics

On Amazon, registered trademarks have more authority over their identity. They also get unique access to essential tools designed just for brands. Amazon Brand Analytics allows you to view the following:

Demographics

In sales promotion, knowing your consumer is critical. It enables you to tailor your content to your most probable customers.

Amazon Brand Analytics allows you access to your customer’s demographics, including their age, estimated income level, educational status, marital status, and gender.

This report’s most significant value to vendors comes from the changing demographic parameters. You can make adjustments based on the following variables:

  1. Sales by age group – Amazon divides this classification into six purchaser subgroups so you can observe which age ranges connect with your goods or campaign the best.
  2. Household income-You may discover where the purchaser fits in one of the nine socioeconomic status groups.
  3. Education status – Amazon gives information on a customer’s educational level, which might affect how you sell to them.
  4. Gender– You can see if a male or a female bought a particular item.
  5. Marital status– Sellers can discover if an item is better preferred by single or married individuals.

It’s worth noting that most Amazon users share profiles with their spouses or children, so keep that in mind while analyzing the data.

Demographic data can help you get a better idea of your typical customer. You may use this information to create complete customer profiles and improve your marketing and sales funnel.

Item Comparison and Alternate Purchase Behavior

This report uncovers the top competing products that your Amazon customers compared with your product and eventually purchased. Knowing this information helps highlight conversion challenges when consumers look at your goods on Amazon and then opt to buy something else.

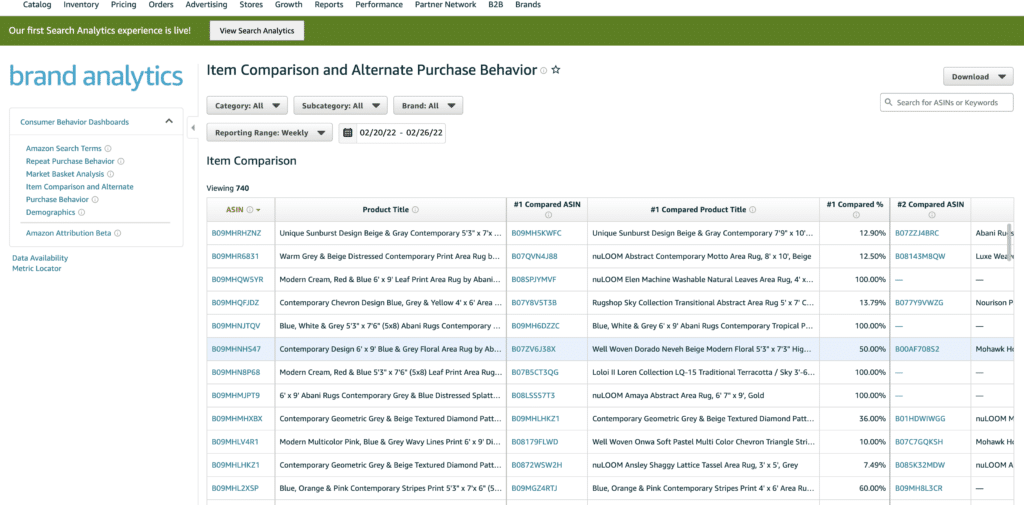
You may utilize this information to enhance your current product offering. 

The following parameters are used in the comparative report:

  1. Compared ASIN (Amazon Standard Identification Number) – The ASIN compared to your product.
  2. Compared percentage – The number of times a product has been seen on the same day as yours.
  3. Alternate purchase behavior– Enables you to observe what competitors’ items people purchased after viewing yours.
  4. Purchased percentage – The share of orders with the ASIN relative to overall orders with other items.

You also receive detailed statistics on how frequently your products become contrasted to the top three comparable goods.

Amazon claims that “This gives Rights Owners immediate access to rival products, allowing owners to make more informed product offering and marketing decisions.”

Amazon Search Terms Report

The Amazon keyword search report is an excellent resource for determining:

  1. Additional search phrases. 
  2. The frequency with which specific terms are used.
  3. The frequency with which particular terms are used. 
  4. Most popular goods listed for every search term.

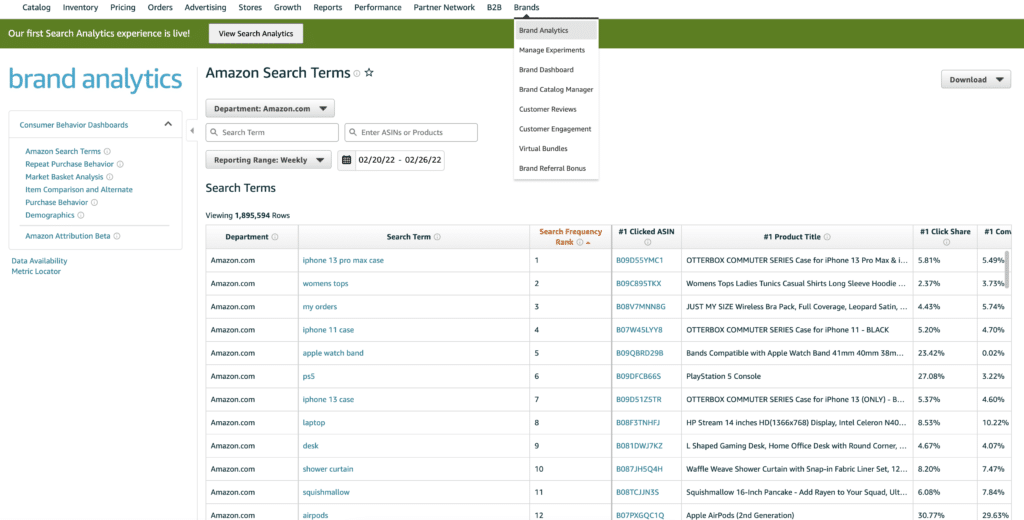
This is a great tool that may assist you with keyword research and determining which of your rivals is receiving the most first-page clicks. The analysis might assist you in generating different keywords to use in your marketing and product listing.

This tool will assist you in determining how shoppers locate your items and those of your rivals on Amazon. You may look for a particular phrase to discover what goods Amazon shoppers are focusing on when they search for it. You can also search for a particular product to see which keywords are causing Amazon shoppers to click on it.

Remember that a keyword is a set of words you want to target, but a search term is what clients type into Google or any other search bar.

The Search Terms data also tells brand owners which of their items have slipped out of the top three most clicked ASINs for a specific search phrase, as well as the previous week’s visit rank. Amazon refills the table once a week. If the list is blank, it means that one of the following is true:

  1. Compared to the previous week, no goods have dropped out of the top three clicked ASINs for all the search phrases. 
  2. There were no goods in the top three views in the last week.

Trellis Simplifies

What is the meaning of search frequency rank?

The actual rank of a particular search term’s prominence, when contrasted to other search queries over a specified period, is known as search frequency rank.

What is the difference between a click share and a conversion share?

Click share and conversion share are similar. It is calculated by dividing the number of times Amazon clients bought a specific product after searching for a phrase by the number of times the customers clicked on a product upon searching for that phrase.

Repeat Purchase Behavior

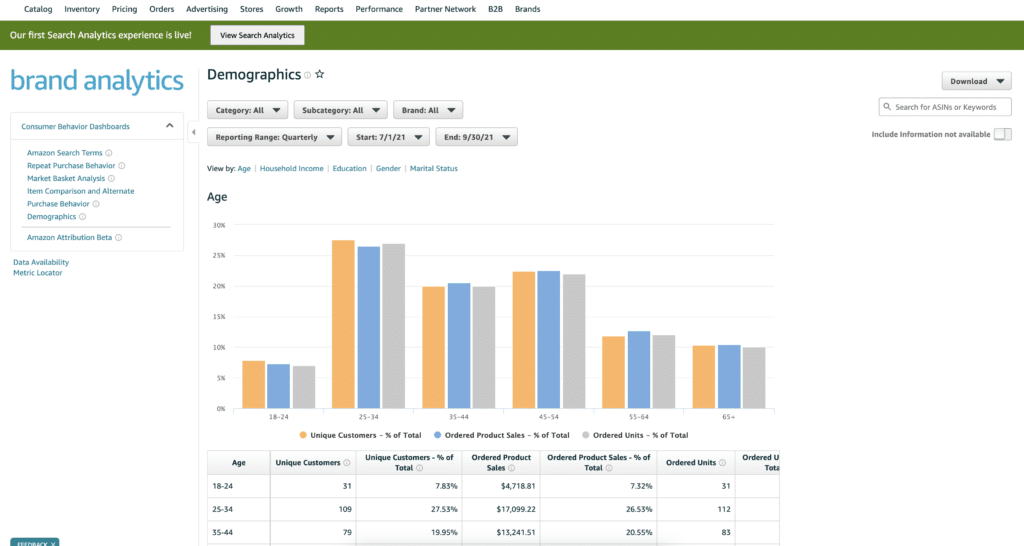
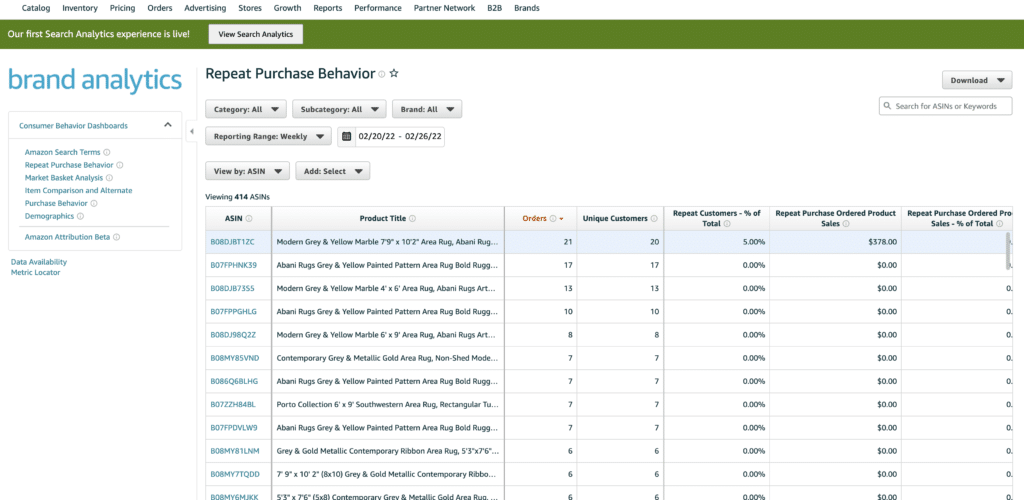
This report intends to assist you in developing a better strategy for generating repeat client transactions. You can also utilize this data to see if your campaign brings in new consumers or concurrent purchases from existing customers.

This report displays the cumulative number of orders obtained for each item and the percentage of orders from unique clients. The following metrics are displayed:

  1. ASIN orders.
  2. Unique clients.
  3. Revenue from repeat purchases.

You may also determine products with the greatest possibility of being repurchased if you want to learn something more about your products. This knowledge might lead to you investing more money in first conversions or bidding higher for associated key phrases.

Market Basket Analysis Report

This report shows you exactly what additional products your clients are ordering when purchasing your products. If you notice that customers frequently purchase a rival’s product alongside your own, you may perceive an opportunity to showcase a comparable item to yours.

This can help small businesses figure out how to expand their entire product range.

This information can assist you in developing new sponsored goods campaigns. Furthermore, if your items are purchased in tandem through PPC (Pay-Per-Click) ads, they are much more likely to appear in the “Customers who bought this item also bought” area.

How to Use Amazon Brand Analytics?

Utilize the following guidelines to learn how to utilize Brand Analytics:

  1. Analyze and understand consumer buying behavior to help you in product research and development.
  2. Use your Amazon Brand Analytics findings to optimize your product listings, such as by focusing on new search phrases.
  3. Check out your Amazon Brand Analytics insights on a weekly, quarterly, and annual basis.
  4. Update your advertisement targeting options and create new marketing strategies to optimize your Amazon advertising.
  5. Use SEO (Search Engine Optimization) and PPC to pursue your competition and improve your overall market share.

If you consider all these points, you can rest assured you will increase your overall market share.

Improve your Overall Brand Outlook with Trellis

Without consumer information, optimizing your marketing and sales funnel is akin to operating a vehicle blindfolded. You could get to where you want to go, but the odds of arriving in one shape are slim.

Amazon Brand Analytics is a free online tool that you should use to maximize the return on each of your product and advertising plans.

But what if you have no idea how to accomplish it? Trellis’ purpose is to assist you in getting the most out of your Amazon advertising initiatives. Explore the power of the demand generation platform built for eCommerce now. Our team of seasoned eCommerce mentors is here to help you every step of the way. 

Areeba Khan

Areeba Khan

Areeba is the Marketing Manager at Trellis. A demand generation platform for leading eCommerce brands. Trellis offers an all-inclusive advertising automation solution to help brands find the 'right' customers across the world's largest online marketplaces.

Leave a Reply Cancel reply

Your email address will not be published. Required fields are marked *

Trending Posts

Understanding the Amazon Impression Curve

Understanding the Amazon Impression Curve

July 7, 2023
How to Improve Your GMV on Amazon?

How to Improve Your GMV on Amazon?

July 4, 2023
Using strategic ecommerce automation

Case Study: 450% Growth With Strategic 4P Automation

June 29, 2023

See how you rank among your competitors.

Get additional insights about your category with our live dashboard. 

Download Your Report

Choose To Sell More With Trellis

Book a Demo

Subscribe for growth tips and tricks straight to your inbox.

Facebook Instagram Linkedin Twitter Youtube

Get Started

  • Schedule a Demo
  • Sign Up
  • Pricing

Product

  • Advertising Automation
  • Dynamic Pricing
  • Product Content
  • Promotion

Solutions

  • Growing Brands
  • Established Brands
  • Agencies
  • Brand Aggregators

Company

  • About
  • Partners
  • Contact Us
©Trellis Corporation 2023 •  Privacy Policy •  Terms and Conditions
cross