



Amazon vs Walmart RoAS Scorecard
Find out if your Amazon and Walmart RoAS can be compared, what's driving the gap, and what to fix first.
It comes filled in with sample numbers, so you can see every result before you add yours. Type over the yellow cells and the sheet does the rest:
- Checks your attribution window and products counted line up
- Splits the RoAS gap into click cost, conversion, and order value
- Flags which channel is under break-even
- Tells you what to do next, in plain language
Get the free scorecard
Four fields. The sheet opens in a new tab as soon as you submit, ready to copy.
See the whole result before you type a number
Three tabs. Ten inputs per channel, each with a note on where to find it in Amazon Ads or Walmart Connect. Everything else is calculated.
Start here
Four numbered steps, what the sample brand shows, and the color key: yellow is your input, cream is calculated, green is good, pink needs attention.
Scorecard
Your numbers, a Comparable or Not comparable verdict, TACoS, RoAS, CPC, conversion, AOV, and break-even per channel, the gap split three ways, and a plain-sentence readout of what to do next.
Definitions
Attribution windows, what counts as an ad sale, how CPC is set, and bid floors for every Amazon and Walmart ad type, side by side.
What the sample brand's scorecard says
Open the sheet and this is already on screen. Walmart looks worse on RoAS. The scorecard shows why, and why cutting it would be the wrong call.
29% cheaper
Walmart $1.18 vs Amazon $1.67 CPC.
8.0% vs 13.0%
The driver of the gap, not the window.
3.19 vs 4.00
Walmart needs 3.57 to break even on a 28% margin.
57% vs 41%
Walmart is bringing in the new customers.
Hold Walmart budget flat. Fix the listing first.
Content, price, reviews, delivery speed. Raise bids after conversion moves, not before.
Check the clock before you compare the column
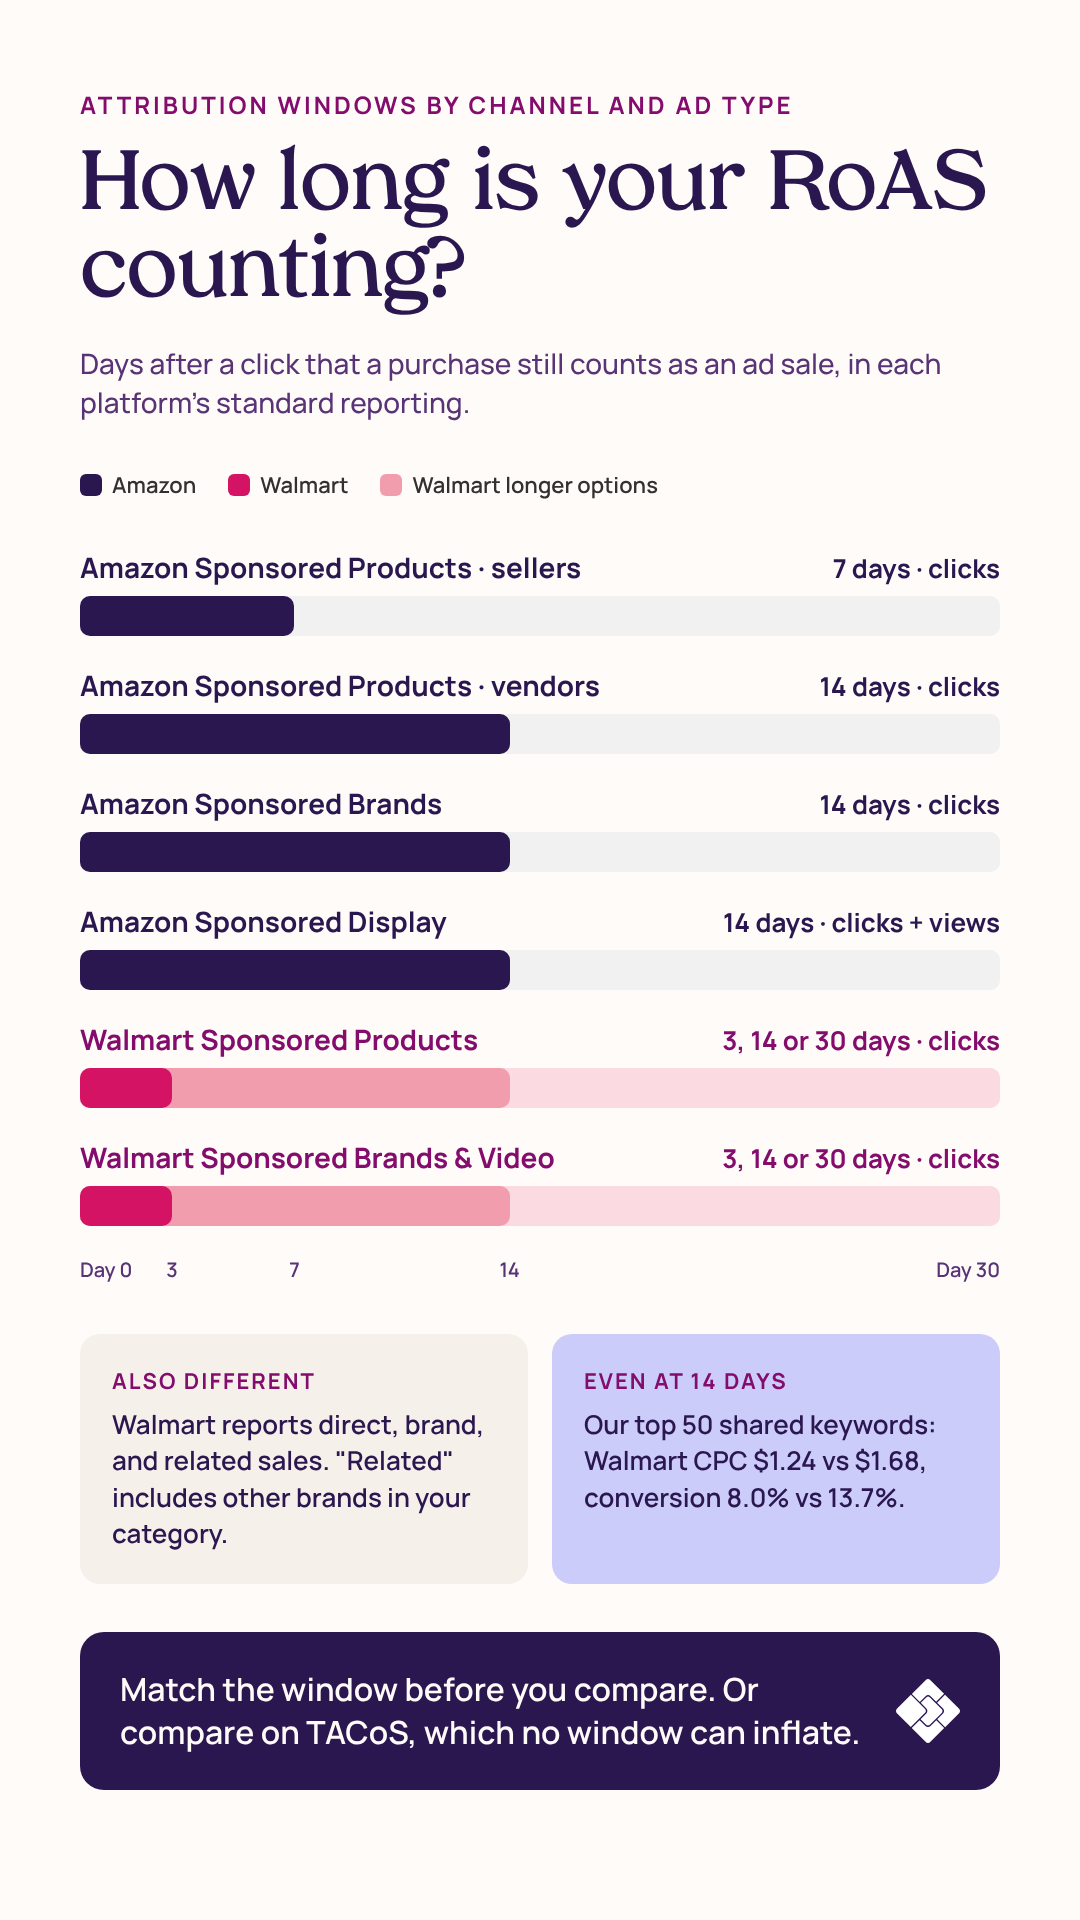
Amazon gives Sponsored Products 7 days for sellers. Sponsored Brands and Display get 14. Walmart lets your tool pull 3, 14, or 30. Pull the same campaign at 7 days and again at 14 and RoAS almost always comes out higher. Same ads, longer clock.
The scorecard's first check is whether your two windows and product sets line up. If they don't, it says so before it shows you a gap, so you don't move budget on a number that was never one metric.
Ten numbers per channel. No exports to reformat.
Spend, ad sales, total sales, clicks, orders, new-to-brand orders, margin, dates, window, and products counted. Each cell tells you where to find it. Type them in and read the verdict.