
Run everything you never had time to implement. Define your process once, and keep it

running with Qore.
PLATFORM

Dashboards & Reporting: Your Numbers, Already Assembled

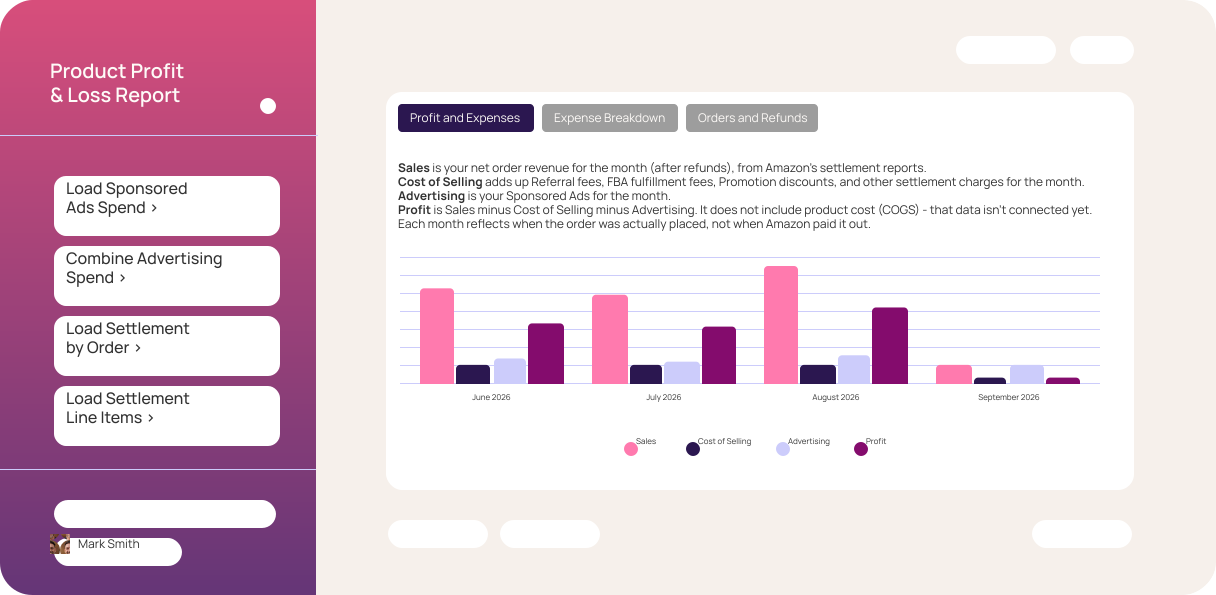
Ads, sales, and inventory joined across every channel, charted at the ASIN and keyword level, and rerun on a schedule so the same report lands every week. Trace any number to its source, then send it as a link or a deck.

Try Qore
Open beta, built on Claude via MCP.
What’s different
Reporting that grows your business,
not your to-do list.
Hours back
The weekly pull, the monthly deck, the number someone always asks for: assembled for you instead of rebuilt by hand every time.
Every figure traces back
Click into any number and see the rows behind it. Report at the level performance lives: the keyword, the ASIN, the placement.
Build once, reruns itself
Set the report up the way you want it, put it on a schedule, and the same view lands every week. Week-over-week is finally a real comparison.
Ready to present
Your brand kit, a shareable link with no login, and export to a deck. Walk into the review with it built instead of building it the night before.
Why not just ask an LLM
Ask a general assistant for the same
report twice and you get two reports.
Ask a general assistant for the same report twice and you get two reports.
It re-derives the logic each run, so the numbers drift, the columns move, and totals that should reconcile do not. Paste in two exports and it will happily average across them without noticing they never joined. Fine for a
one-off. For a report you compare week over week, sameness is the whole point.
It re-derives the logic each run, so the numbers drift, the columns move, and totals that should reconcile do not. Paste in two exports and it will happily average across them without noticing they never joined. Fine for a one-off. For a report you compare week over week, sameness is the whole point.
A general assistant
Rebuilds it each time
  • Re-derives the logic every run, so numbers drift
  • Joins two exports that were never meant to join
  • Runs on the CSV you pasted, stale the moment you sent it
  • Formats a little differently each time you ask
  • Leaves you verifying the output before you can trust it
Qore reporting
Runs the same one every time
  • Encodes the logic once, so every run matches the last
  • Joins ads, sales, and inventory on a shared data model
  • Reads your connected accounts, not a pasted snapshot
  • Holds its layout, so week-over-week actually compares
  • Shows the rows behind every figure, nothing to second-guess

How it Works

Unify

One picture across every channel you sell on: Amazon, Walmart, Shopify, Google, and TikTok, with ads, sales, and inventory joined on a shared model. No more stitching exports from five tabs.

Answer

One question, one answer, at the grain where the cause sits: the ASIN, the keyword, the placement. Not a folder of exports you still have to reconcile, and every figure shows the rows behind it.

Inform

The report reruns on schedule and lands where people already look, refreshed and consistent. Everyone stays current on how the account is doing without pulling a number or asking you for one.

Unify

One picture across every channel you sell on: Amazon, Walmart, Shopify, Google, and TikTok, with ads, sales, and inventory joined on a shared model. No more stitching exports from five tabs.

Answer

One question, one answer, at the grain where the cause sits: the ASIN, the keyword, the placement. Not a folder of exports you still have to reconcile, and every figure shows the rows behind it.

Inform

The report reruns on schedule and lands where people already look, refreshed and consistent. Everyone stays current on how the account is doing without pulling a number or asking you for one.

Try Qore
Worked example
“Build the monthly review for this client.”
The day of pulling numbers into a deck, done once and rerun every month.
You
Build the monthly review for this client.
1
Rolling 30 days, versus the 30 before it.
Revenue, spend, TACoS, and units, each with the period-over-period move, pulled from the connected account rather than a export.
2
Top products by revenue and by spend.
Ranked, with the ASIN-level detail sitting underneath each row for when the client asks.
3
Charted in your brand kit.
Your colors and logo, the trend lines grouped the way you present them, pinned to a dashboard you can open live.
4
Exported to a deck, or shared as a link.
A read-only client link with no login, per-widget CSV where you allow it, and password and revoke when you need them.
5
Scheduled for the first of every month.
Next month it runs itself and arrives already built. You review it, you do not rebuild it.
What it will not do
The report you can hand over without checking it.
The reason a general model's report needs checking is not the chart, it is the four things it does quietly. Reporting
here is built so none of them happen.
The reason a general model's report needs checking is not the chart, it is the four things it does quietly. Reporting here is built so none of them happen.
NO
Drift between runs.
The logic is encoded once. The same inputs return the same numbers, so a move in the report is a move in the account, not in the method.
NO
Numbers that don't reconcile.
Totals are recomputed from the rows every time, so the summary and the detail always agree and the columns add up to what they claim.
NO
Data joined that shouldn't be.
Ads, sales, and inventory meet on a shared model with keys that line up, not two exports averaged together because the dates looked close.
NO
A different report every time.
The layout holds from one run to the next, so the thing you present in March lines up against the thing you presented in February.
NO
A number without its source.
Click any figure and the rows behind it are right there. If a window is partially attributed or a connector is stale, the report says so.
Use Cases
The dashboards and reports operators build with Qore and rerun every week.
Report and Review
Stop building the same report
Every recurring report you build by hand is time you spend the same way each week. This runs it for you.
Ads
3 skills
Amazon
Walmart
Report and Review
Build the monthly review
The monthly review is a day of pulling numbers into a deck. This starts you from a finished draft.
Ads
3 skills
Amazon
Walmart
Report and Review
See what a customer is really worth
First-order revenue hides the real number. Built on your AMC and order data, this shows what a customer is worth over time, by cohort.
Orders
3 skills
Amazon
Walmart
Related Surfaces
Ask
Q
Assistant Q
Ask for the report in plain English and get it back with the chart.
See Surface>
Skills
Builder
Skills Builder
Turn a report into a skill that runs and delivers on a schedule.
See Surface>
AMC
Clean Room
AMC Clean Room
Path-to-purchase and new-to-brand reporting from your AMC data.
See Surface>
Meetings
& Tasks
Meetings & Tasks
Turn a client review into follow-ups tied to the account.
See Surface>

500+

brands in
open beta

brands in open beta

$900M

in GMV
under execution

in GMV under execution

100B+

tokens

processed

tokens processed

80%

of the weekly workload
Qore takes on

of the weekly workload Qore takes on

Frequently Asked Questions

Yes. There is a demo-data sandbox where you can build a dashboard and watch a report run before you connect an account.

Yes. Mint a read-only link in two clicks, no login for them. Set a password, choose which widgets are downloadable, and revoke access any time.

Dashboards export to PDF and a shareable link. Decks export to PowerPoint and Google Slides. Tables and charts export to Google Sheets and Excel.

Yes. Any report can run hourly, daily, or weekly and deliver itself to a link, Slack, or a deck. It needs one full successful run first.

Connect your account, build the report once, and schedule it. Qore reruns it on your cadence and delivers the refreshed version to a link, Slack, or a deck, with no manual pulls in between.

Yes. Ads, sales, and inventory sit on one joined data model, so TACoS and total-view reporting come from a single source instead of stitched spreadsheets. Cost inputs can be added to extend margin views.

A dashboard refreshes against your connected account on the schedule you set. How current the underlying figures are depends on the source: Amazon Marketing Stream delivers hourly performance data, while some Seller Central reports arrive on Amazon's own lag.

Look for three things: it reads your account directly instead of pasted exports, it joins ads with sales and inventory rather than reporting ads alone, and it reruns on a schedule so the view is consistent week to week. Qore reporting is built on all three.

Yes. Tables and charts export to Google Sheets and Excel, and a finished deck exports to Google Slides and PowerPoint. Dashboards also share as a live link, so you can send the view itself instead of a file.

Stop rebuilding the report.
Build it once and schedule it.

Connect an account, build a dashboard, and watch the first report run. The open beta has a sandbox if you want to try it on demo data first.
Try Qore