



Is Your Repeat-Customer Base Getting Healthier?
Answering that well is harder than it sounds. It takes user-level purchase data most sellers can only get through a data clean room like Amazon Marketing Cloud, then multi-layered SQL just to stitch it into something readable, without a data team on call. This is a real cohort LTV dashboard, broken down the way you'd need to see it to know.
A Live Sample of the Same Dashboard
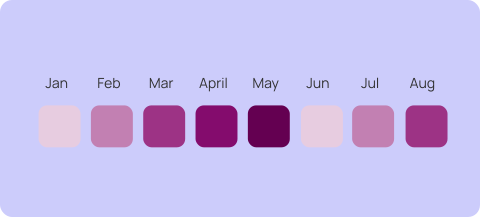
This is a real, interactive cohort LTV dashboard running on sample account data. Click through the metric tabs, scan a cohort's row month by month, and see what the pattern tells you.
4 Questions This Dashboard Answers
Is retention improving or slipping month to month?
Did that remarketing campaign move retention?
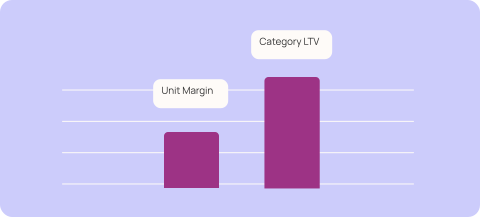
Did the loss-leader strategy pay off in category LTV?

What's each product's true break-even ACoS?


Frequently Asked Questions
One Operator Across Every Channel You Sell On
Qore already runs the recurring work across your ad accounts: the checks, the analysis, the staged actions.
The store joins that same layer, so a catalog audit or a pre-sale price pass becomes a skill that runs on a
cadence and lands in your queue, instead of a task that gets scheduled and quietly dropped.
Qore already runs the recurring work across your ad accounts: the checks, the analysis, the staged actions. The store joins that same layer, so a catalog audit or a pre-sale price pass becomes a skill that runs on a cadence and lands in your queue, instead of a task that gets scheduled and quietly dropped.