



Weekly Impression Drop Monitor
What it looks at, what it flags, what comes back, what you can change.
- Your Amazon ad data, on the marketplace you choose
- The last seven days, against the seven before it
- Impressions, spend and sales, per advertisement
- Impression change measured per advertisement
- Drops at or beyond the threshold you set
- Spend and sales carried alongside, for context
- Flagged ads sorted by impression change
- A weekly view: how many flagged, and what they cost
- An email to the recipient you name
- Marketplace, drop threshold, recipient
- Sort order and time-series lookback
- Changed on a run without touching the template
How many ads dropped each week, and what they cost
Weekly ad time-series · sample
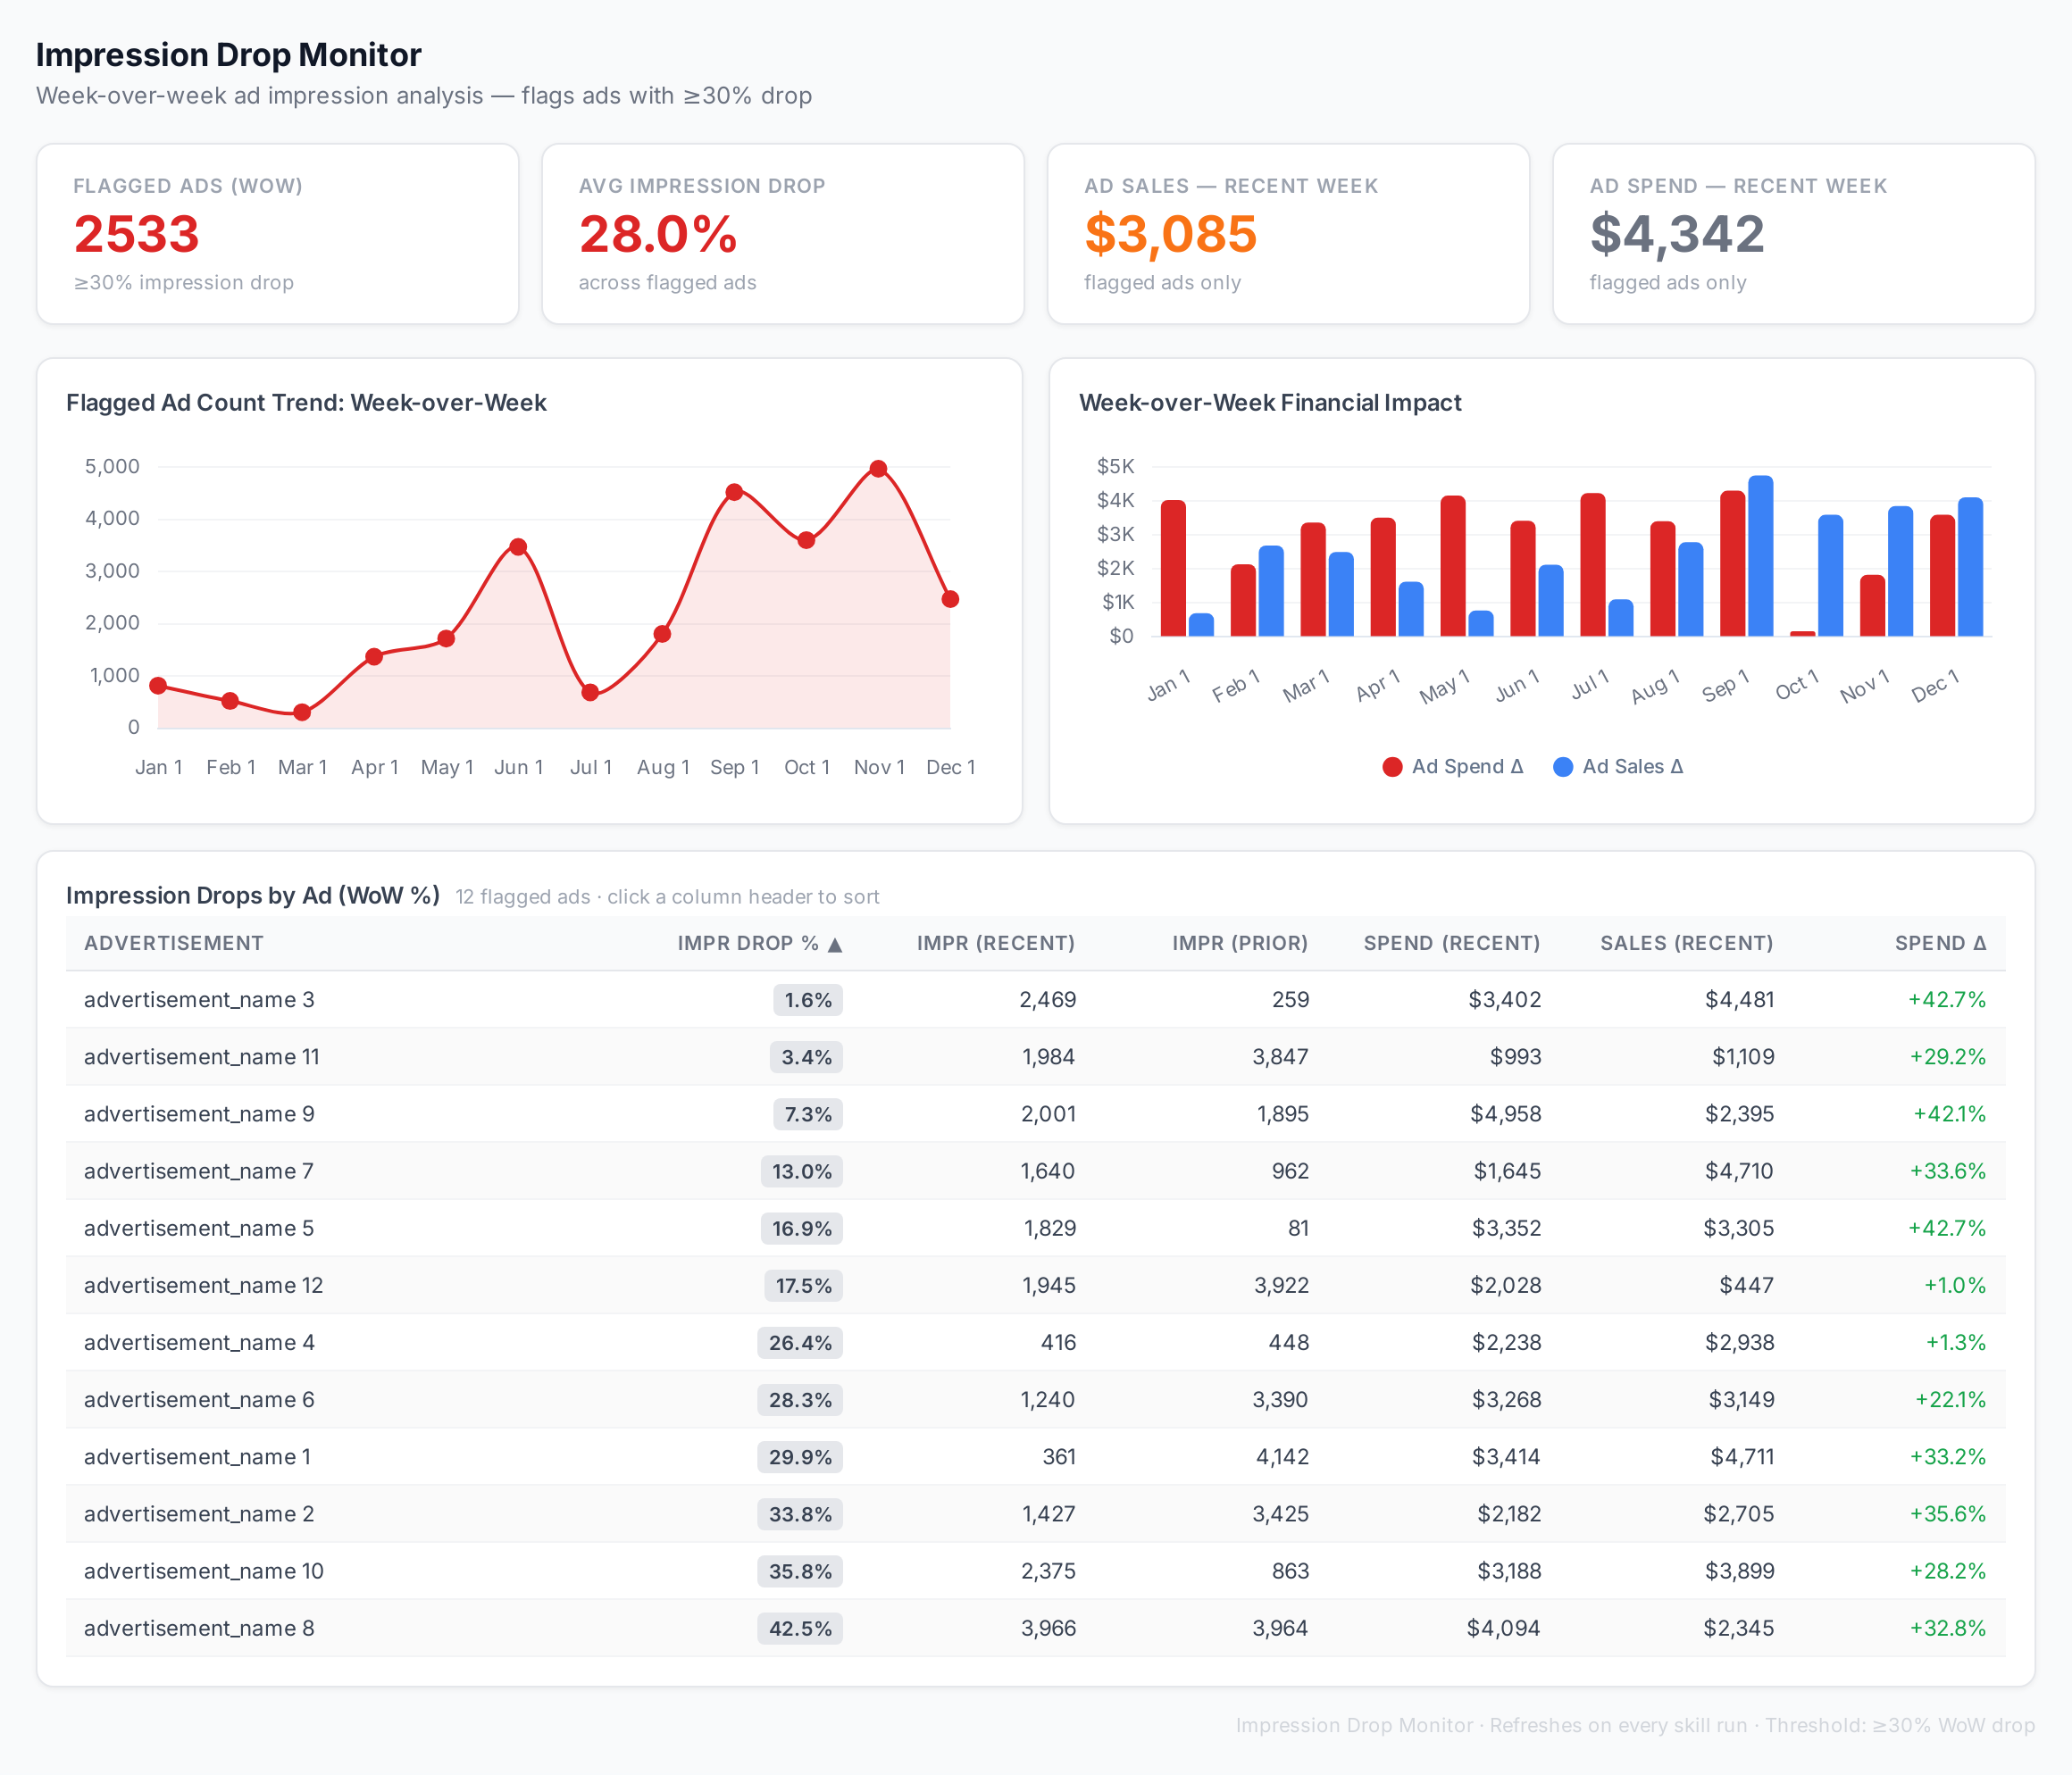
Sample figures. Your own numbers appear the first time the skill runs.
Frequently Asked Questions
This skill splits the last fourteen days into two seven-day windows, aggregates impressions per advertisement, and compares the two. Ads whose impressions fell past the threshold you set are listed, worst drop first.
The skill does not diagnose the cause; it tells you which ads dropped and by how much. From there you check budget caps, recent bid changes, and competing campaigns on the same ads.
Yes. When flagged ads are found, a summary email goes to the recipient you name in the settings. Email only — there is no spreadsheet export.
Does this skill change my bids or budgets automatically
The trend is built from weekly time-series data over the lookback you set, giving one row per week: the count of flagged ads and the spend and sales attached to those drops.
It loads thirty-five days of ad data to cover five full ISO calendar weeks, then reports how many ads were flagged in each week and the spend and sales behind those drops.
Every one of these runs on your own account.